Seasonal Trading and Investing Strategies

Years ago a reader named Eric from DataPunks blog posted an interesting analysis that looked at timing your market buys in the S&P500. He wrote some R code (see below) that segmented the market returns between November to April and May to October. He wanted to see if there is a seasonal effect to trading or investing in the markets and create a novel strategy. His analysis caught my eye because I was interested in timing the market using my AI models.
What I wanted to do was figure out when to move my money from the sidelines into the market and when to take it out. I thought I could catch big trend moves higher and sidestep market crashes. Did it work for me? Not quite, in the end, my AI models didn't perform as I had hoped but Eric's analysis remains valid to this day.
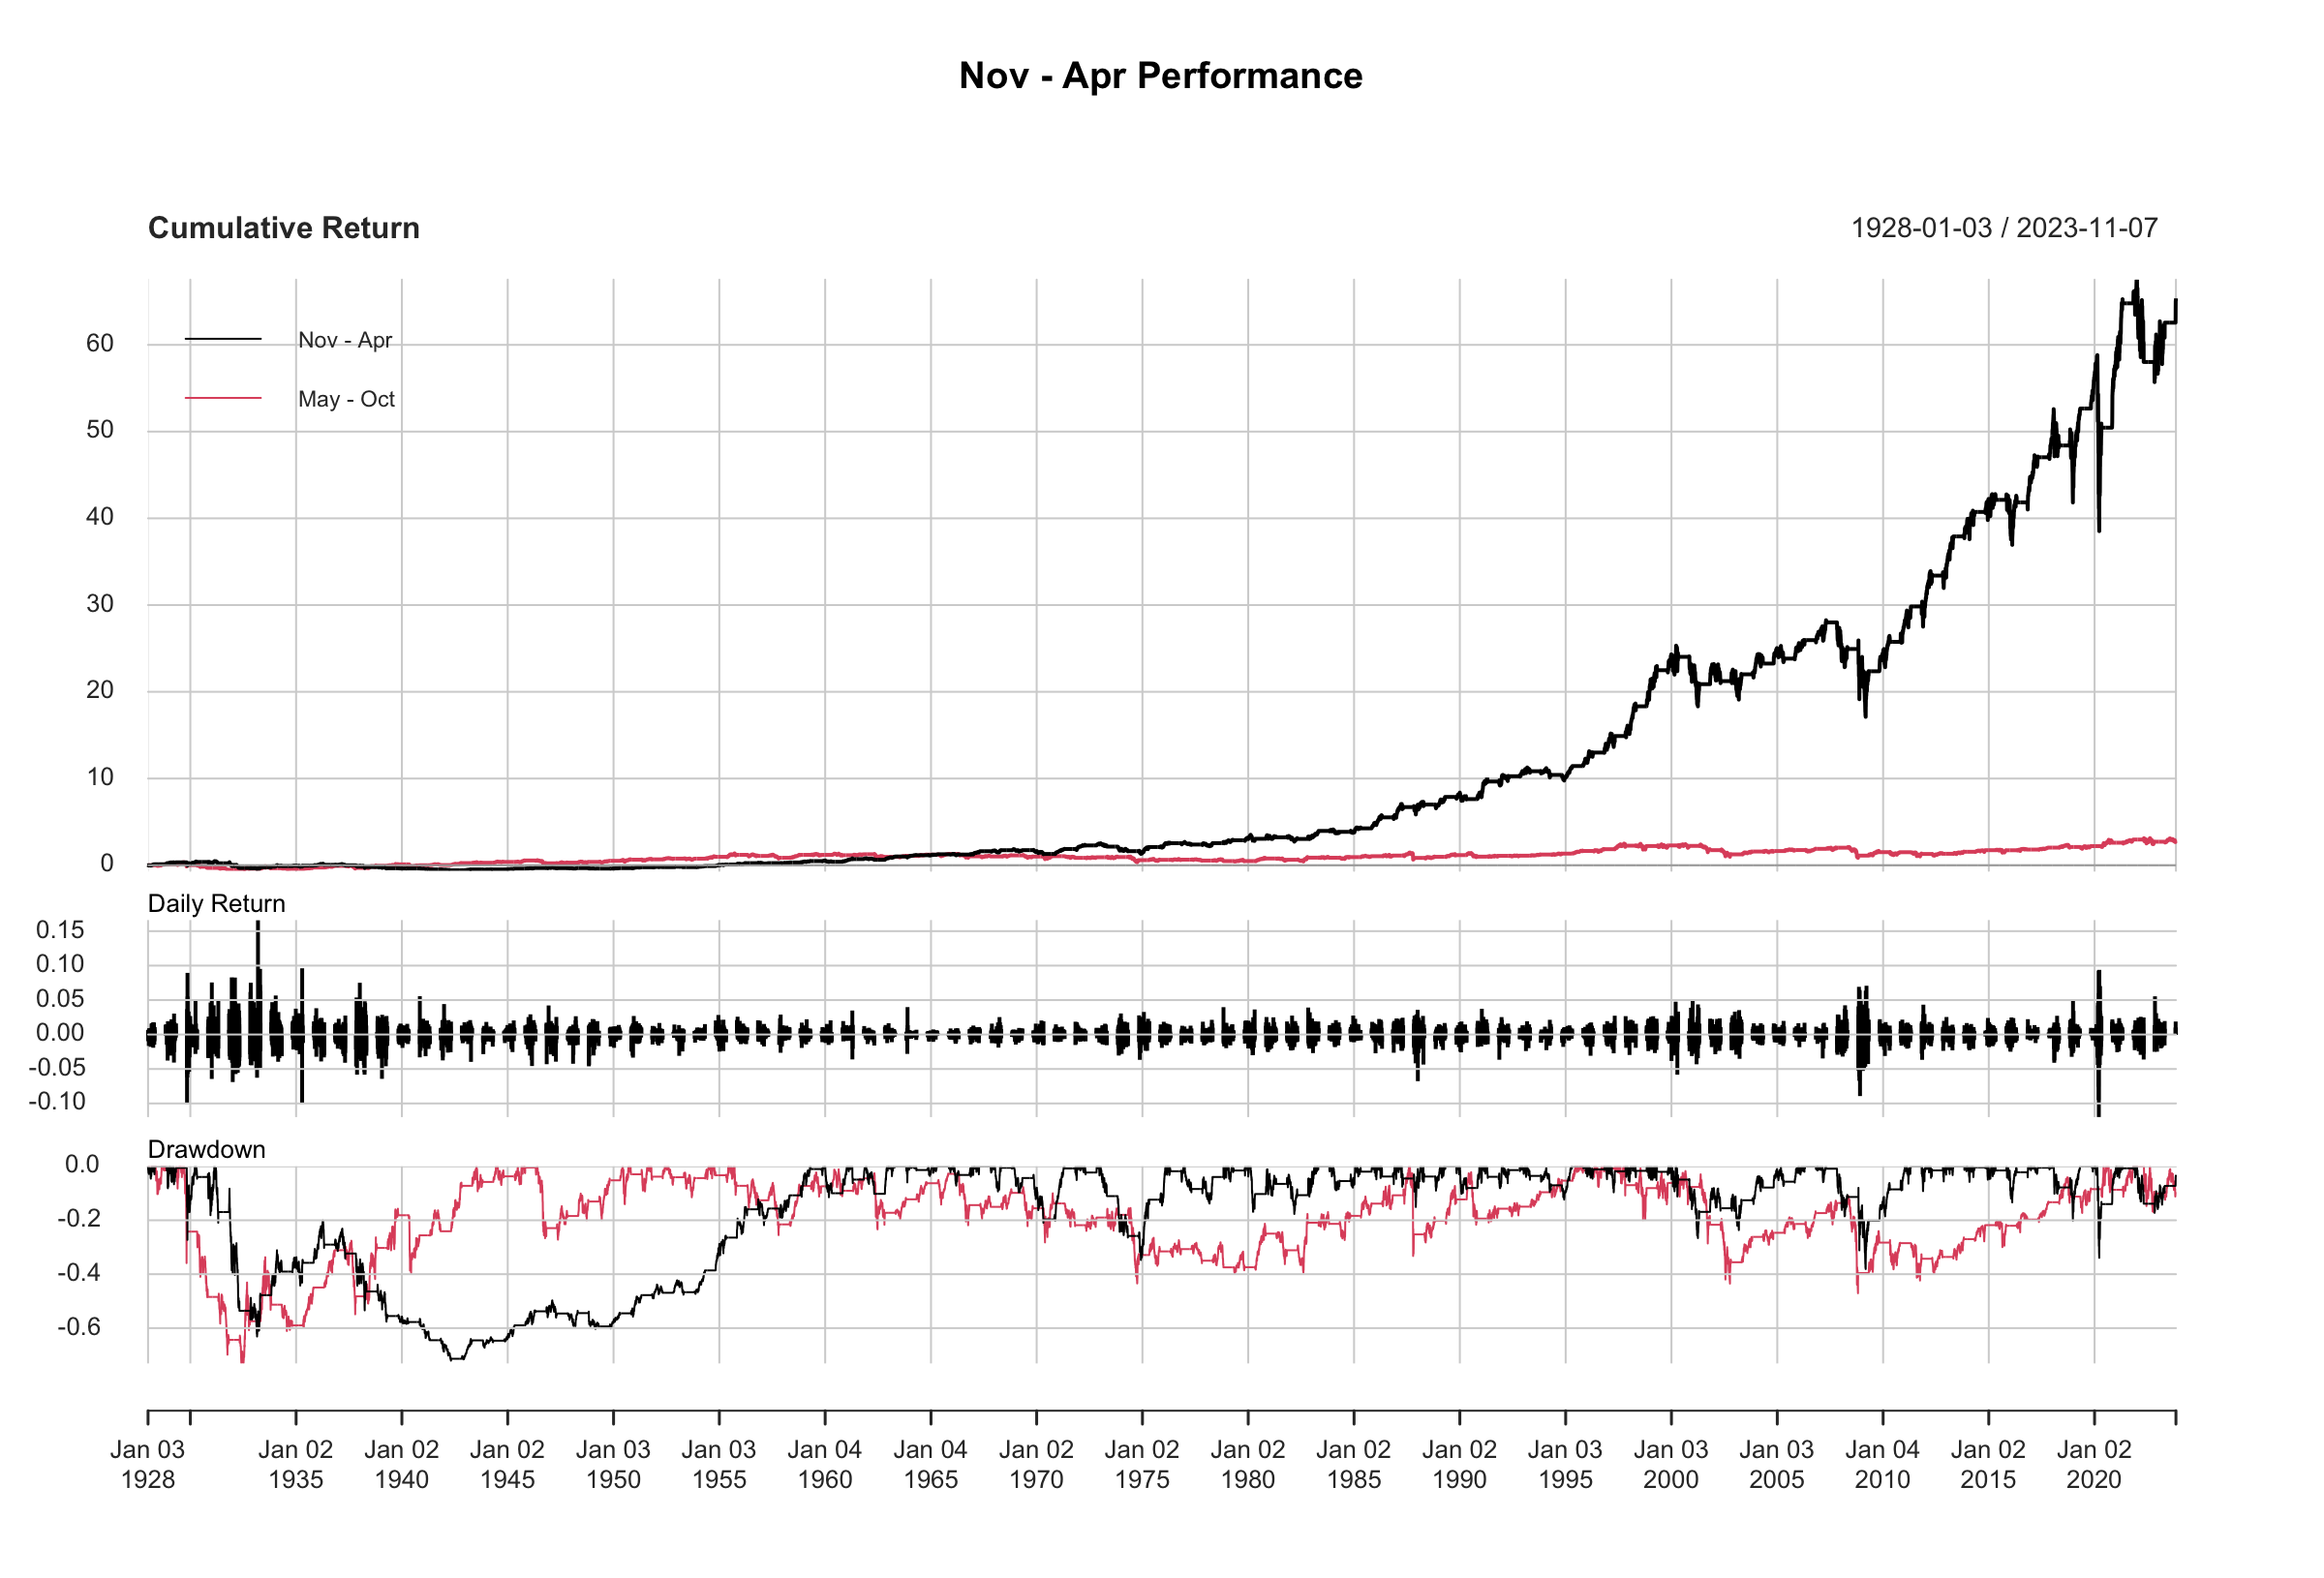
Valid in the sense that it should occupy a valuable spot in the back of your memory. I took some time and found his old R code and updated the chart I posted back in 2010 with a new one that's current through the writing of this post.

You can see that the market started to perform well in the November to April time frame around the 1970s. The old saying in the markets of "Sell in May and go away" or the "Santa Claus rally" holds some truth to it.
Note, that I said "some" because if you look at the entire chart from the S&P500's inception, there are times when the period from May to October outperformed. With my current long-term investing strategy, I don't care if May to October outperforms sometimes. Why? Because I remain fully invested in the markets, I don't time them anymore. The only time-related component I do in the markets now is to rebalance my asset holdings.
I apply what I learned from Eric's analysis to my retirement accounts by rebalancing them in May and October. Instead of picking some arbitrary time and day to rebalance, I make sure to rebalance at the end of April and the end of October. This way I'll take profits from the leading funds and assets and add those profits to the laggard asset classes. Then I let the assets in my portfolio do whatever they'll do.
I could, if I wanted to, trade technology stocks or "hot" sectors/industries from November to April, but that would just churn up fees for me and short-term capital gains. What works for me, in my humble opinion, is to remain invested in diversified assets for the long term.
R code
This was Eric's R code to generate the above chart. You'll need to install the Quantmod and PerformanceAnalytics packages for R.
You can swap out the ^GSPC symbol for another asset class like RUT or QQQ, you'll see similar results.
require(quantmod)
require(PerformanceAnalytics)

getSymbols('^GSPC', from='1900-01-01')

d <- index(GSPC)
getMonth <- function(i) {
  as.numeric(format(i, format="%m"))
}
firstHalf <- function(i) {
  ifelse(getMonth(i) <= 4 || getMonth(i) >= 11, 1, 0)
}
hold1 <- unlist(lapply(d, firstHalf))
hold2 <- 1-hold1
hold1 <- xts(hold1, d)
hold2 <- xts(hold2, d)

perf <- merge(hold1 * ROC(GSPC[,4], type='discrete', n=1), hold2 * ROC(GSPC[,4], type='discrete', n=1))

colnames(perf) <- c("Nov - Apr", "May - Oct")
charts.PerformanceSummary(perf)
Additional Reading
I completely switched my investing style from short-term trading and market timing to a long-term one. What caused me to change was reading "A Random Walk Down Wall Street" by Burton Malkeil. I highly recommend reading it if you're interested in building wealth.


Member discussion