FBProphet Forecasting

This tutorial will show you how many followers you should expect in the coming days and weeks using the Facebook Prophet (FBProphet) Python package. This is a perfect example of what Python can be used for. You can use it to forecast your medium followers or sales revenues. It can be any time series-related problem, but first, you must install FBProphet.
Install FBProphet
My code is simple, and the FB Prophet documentation is written very well. In fact, most of the code I share below has been cobbled together from the examples the documentation provides.
Before we begin, you must have Python installed on your machine. You must have pandas and matplotlib installed as well, or at least have the ability to import another visualization library you want to use.
I have the Anaconda distribution installed so I usually do conda install <package> and go from there.
For my Python 3.7 environment that would be:
conda install -c conda-forge fbprophet
conda install -c anaconda pandas
conda install -c conda-forge matplotlib
OR if you have the pip package installed, you can simply do pip install fbprophet.
The first step is to go to use your favorite IDE. I like to use Jupyter Notebook but feel free to use whatever works for you.
Create your first Medium FBProphet forecast
Once installed, you'll see a new tab called "Forecast". Click on it to open up the forecasting interface. Enter your username and password (if you haven't set one yet) and then select the type of data you'd like to forecast.
The second step is to initialize the packages and we do it like this:
import pandas as pd
from pandas import to_datetime
import matplotlib.pyplot as plt

from fbprophet import Prophet
from fbprophet.plot import add_changepoints_to_plot
The third step is to create a subdirectory called data to save your downloaded Medium audience stats. To find your audience stats download button just go to Stats > Audience Stats > Monthly Growth > Download CSV.

Then save it to your data folder.
The fourth step is to write the data-loading functions using pandas. Here I make sure that the imported date column is recognized as a date time datatype and I do some massaging of the data.
I’ll create a variable called target because I might want to change what I'm forecasting. For this tutorial I have it set as target = 'followers_total' but you can easily set it to followers_gained or followers_lost.
data = pd.read_csv('data/thomasottio-subscriber-stats.csv')
data.head() #check to see if the data loaded in right

# convert date to datetime data type
data['period_end'] = pd.to_datetime(data['period_end'])

target = 'followers_total' #You can set this to anyone column you like

df = data[['period_end', target]]
The fifth step is to convert our new dataframe df to the correct column names. FB Prophet is finicky that way so we do this:
df = df.rename(columns={"period_end": "ds", target: "y"})
The sixth step is to write our FB Prophet code and initialize the model. This is pretty much straight out of the FB Prophet documentation.
# define the model
model = Prophet(interval_width=0.95)
model.add_country_holidays(country_name='US')

# fit the model
model.fit(df)
The seventh step is to prepare the forecast data frames.

future_dates = model.make_future_dataframe(periods=12, freq='M') #MS or M or W

#Forecast predictions
forecast = model.predict(future_dates)
forecast[['ds', 'yhat', 'yhat_lower', 'yhat_upper']].tail(12)
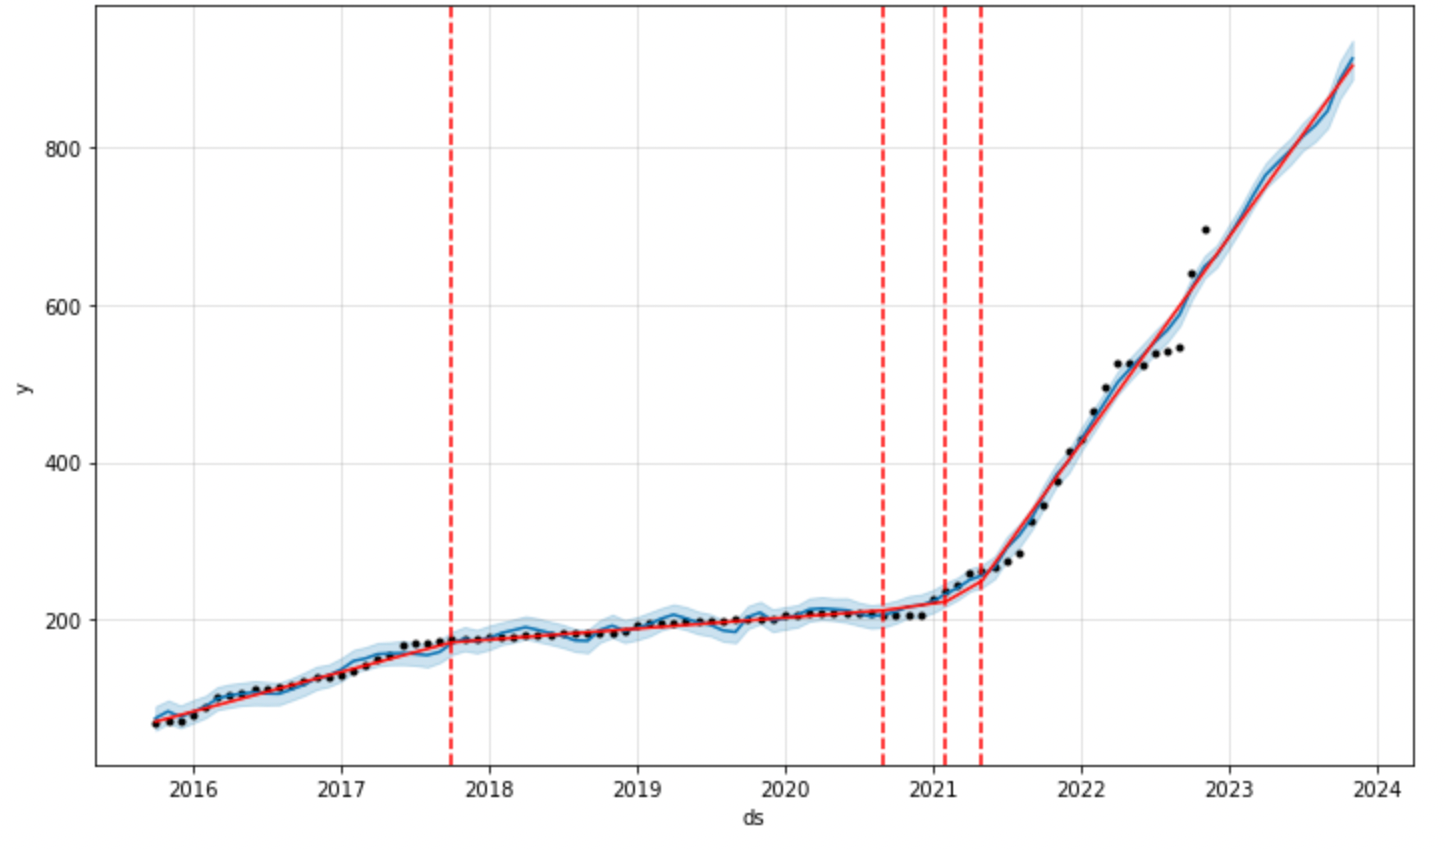
The eighth and ninth steps are to generate the plots. They say a picture is worth a thousand words, and this opened my eyes!

#Create a figure
fig = model.plot(forecast, uncertainty=True)

#Add trend turning points to figure

a = add_changepoints_to_plot(fig.gca(), model, forecast)

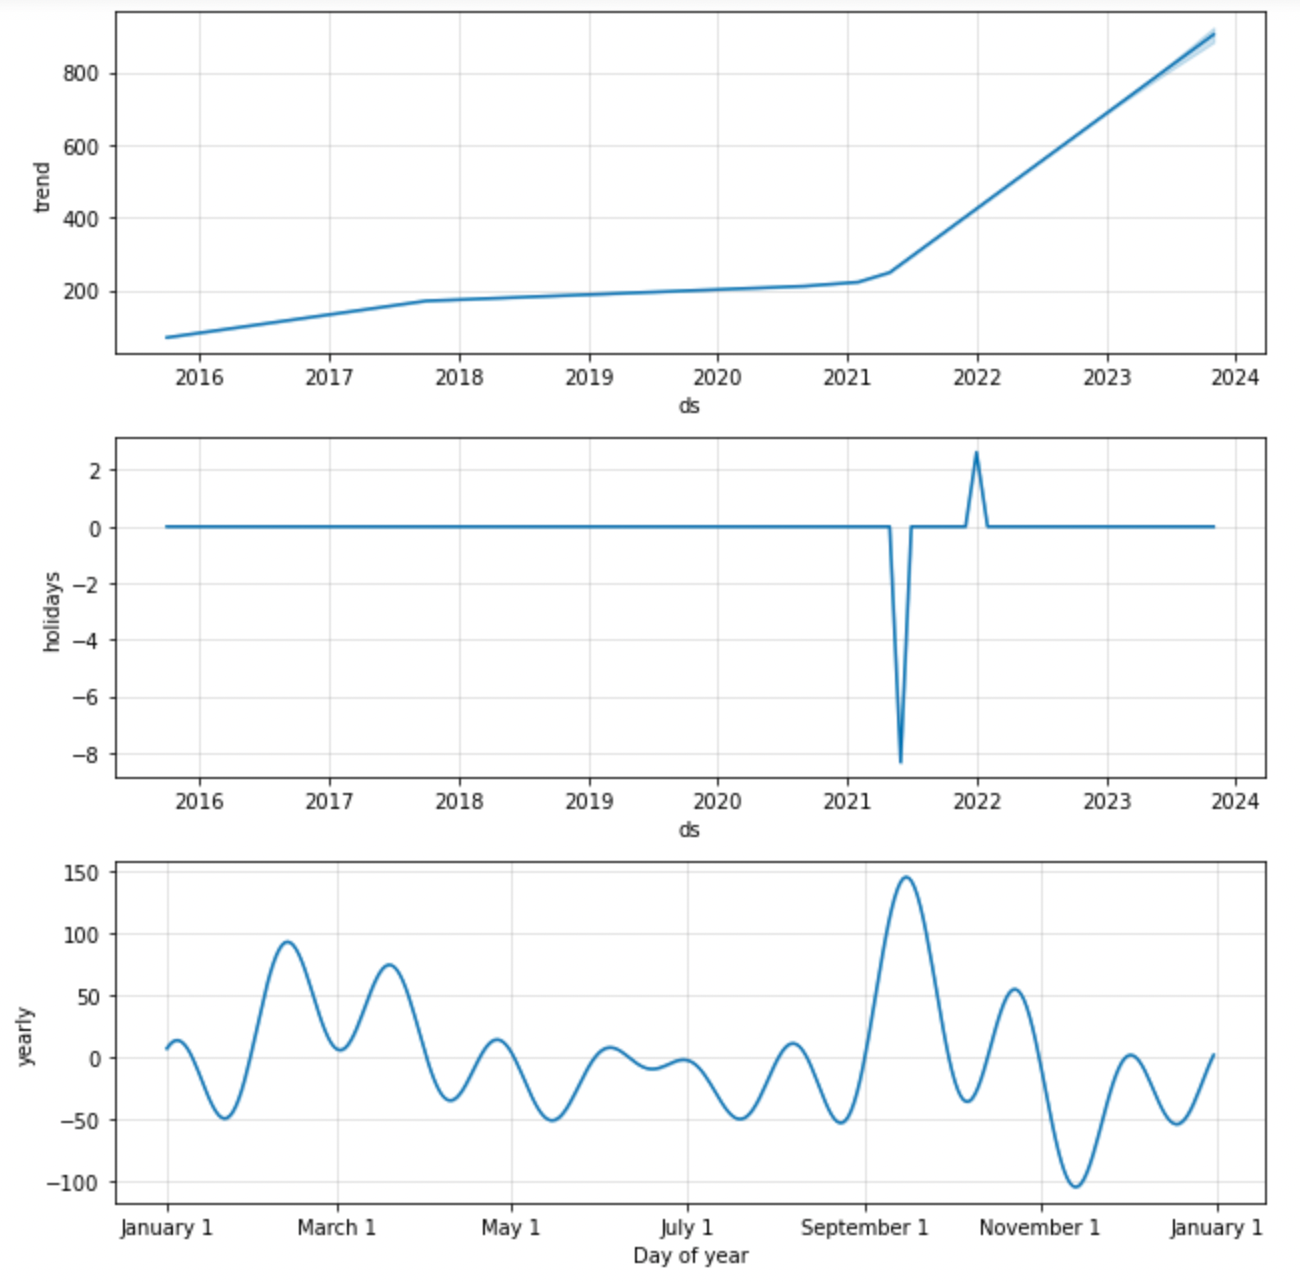
model.plot_components(forecast)
My results
When I run the above code it generates five plots for me. One is the standard time series line plot and the other three are the time series components.

Those components show my trend, my seasonality, etc. All the components you need for time series decomposition and evaluate if your growth is solid or crap.

What can I glean from this? I had four trend changes, the first one was when I started to dabble at cross-posting to Medium from my typical blogs, which happened toward the end of 2017. Then when I started posting in earnest in 2021, my trend changed thrice as I attracted more followers.
It doesn’t take a rocket scientist to figure out that the more active you are the more the Medium engagement algorithm rewards you.
A few other things I can glean from these results. At the current growth rate, I should close around 700 followers by the end of the year. The New Year has a positive bump for me whereas Memorial Day has a negative effect.
The seasonality chart also shows where I have peaks and troughs in my follower growth.
These results are handy for me when to time posts or when I should try to “catch the dragon’s tail.”
The entire code for you to copy
If you’re lazy and just want to copy and paste the code, please do so below.
import pandas as pd
from pandas import to_datetime
import matplotlib.pyplot as plt

from fbprophet import Prophet
from fbprophet.plot import add_changepoints_to_plot

data = pd.read_csv('data/thomasottio-subscriber-stats.csv')
data.head() #check to see if the data loaded in right

# convert date to datetime data type
data['period_end'] = pd.to_datetime(data['period_end'])

target = 'followers_total' #You can set this to anyone column you like

df = data[['period_end', target]]

df = df.rename(columns={"period_end": "ds", target: "y"})

# define the model
model = Prophet(interval_width=0.80) #, mcmc_samples=300
model.add_country_holidays(country_name='US')

# fit the model
model.fit(df)

future_dates = model.make_future_dataframe(periods=12, freq='M') #MS or M or W

#Forecast predictions
forecast = model.predict(future_dates)
forecast[['ds', 'yhat', 'yhat_lower', 'yhat_upper']].tail(12)

#Create a figure
fig = model.plot(forecast, uncertainty=True)

#Add trend turning points to figure

a = add_changepoints_to_plot(fig.gca(), model, forecast)

model.plot_components(forecast)
Installing Python - if you need to
This is a simple installation guide to get Python on your machine.
Get the Anaconda distribution
The simplest way to get Python on your Mac, Linux box, or Windows machine is to use the Anaconda version.
Anaconda is just a distribution of Python with many scientific computational packages built in.
Since I work in machine learning/data science, Anaconda is my go-to source for all related things.
I like it a lot because of its package manager. The Anaconda package makes it easy to upgrade and download required packages. It does all the version checking and gets you the right version for your version of Python.
For example, installing FB Prophet is as simple as doing:
conda install -c conda-forge fbprophet
I don’t want to be lame and point you to the Anaconda documentation, but I will. Why? Because you might get stuck and here are some more detailed installation instructions.
Honestly, I’ve never had to read these them. I’ve installed Anaconda on my old Windows machine and twice on two different Macs. It’s pretty simple.
Let’s get started. Go to the Anaconda downloads page and grab the right installer.
Then download and install. Follow the instructions on the screen. It will install the latest version of Python, which at the time of my last installation was version 3.9.
Don’t get any version 2.X, that version because it’s old and no longer being developed. Stick with version 3.7 and greater — I use version 3.7 a lot.
Some gotchas — read first after download
I had no idea what I was doing when I first started venturing into Python. I admit, I was a noob and made so many messy mistakes.
What do I mean by messy mistakes? I had Python libraries and modules all over the place. Sometimes I would install a new library or package and break something else. Other times I would uninstall a package and break something else.
This drove me up the wall until I learned about virtual environments.
Virtual environments are handy wants to keep your projects and tinkering organized. You can create a medium-forecasting virtual environment for your FB Prophet project and a different virtual environment for another project.
Anaconda makes this simple and easy to use with the added benefit of setting up the Python version you want.
Create your first environment
Creating your first virtual environment with Anaconda is as simple as typing this into your terminal or command prompt:
conda create --name my-new-env-name
If you type that above you will also install the default Python version.
If you don’t want to default python version you can just add another argument like python==3.7
conda create --name my-new-env-name python==3.7
Then Anaconda will create the virtual environment and install the base Python packages with the correct versions.
Once you’re done you can activate the new environment by typing:
conda activate my-new-env-name
To deactivate the environment just type:
conda deactivate
Start coding
That’s it, then start coding! I would recommend checking out my Forecasting Medium Follower Growth with FB Prophet article. I provide the sample code and you can always leave me a comment if you get stuck.
If you’re more advanced and want to explore about Python and build your own standalone apps, I suggest checking out H2O.ai’s Wave and Nitro projects. Both are Python-based without the need for learning javascript or CSS, it’s an app framework that comes with batteries.


Member discussion